Scientific visualization
MitoCircos Studio
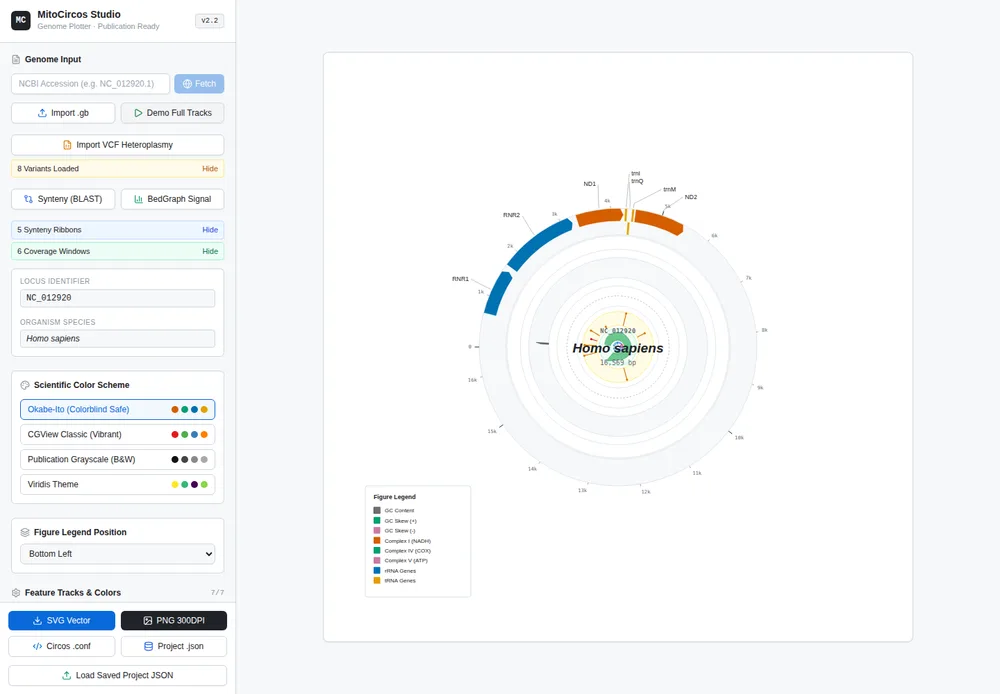
An exploratory visual studio for mitochondrial datasets, using interactive charts to make biological structure easier to inspect.
Data structure
The problem
Dense biological data asks users to hold too much structure in their heads. The interface needed to make relationships, patterns, and context visible together.
Decisions
- Treat visualization as a guided reading experience, not a chart catalog.
- Keep data transformations explicit so visual conclusions remain inspectable.
- Use interaction to reveal detail progressively rather than front-load every label.
Evidence
- React and D3 foundation for interactive scientific visuals.
- Reusable chart surface and icon language for a focused exploration tool.
- A visual direction that connects scientific rigor with approachable interaction.
Services
- Scientific tool design
- Data visualization
- Frontend development
Proof
- Interactive React and D3 visualizations for mitochondrial datasets
- Explicit data transformations and progressive interaction
Architecture
A focused scientific interface combining explicit data transformations with interactive D3 visualization surfaces.
Approved material
Privacy
No unpublished research data or private datasets are included.
What I learned
- Scientific tools earn trust when the visual story is inspectable.
- Good data UI leaves room for curiosity without hiding the underlying structure.